Compared
Posts on comparative procedural law and access to justice.
Indicators of judicial efficiency in comparative law
Comparison between the main indicators of judicial efficiency and the indicators of the CNJ.
The studies of the CEPEJ (European Commission for the Efficiency of Justice) use two efficiency indicators. The first is a kind of "clearance rate" and the second is the "disposition time". Logically, the shorter the time for judging the case, the less congested the system will be.
The first indicator measures the number of cases resolved over the number of cases received. Essentially, this indicator is used to assess the capacity of a judicial system to handle the influx of court cases. The higher the index, the more the Judiciary will be able to reduce its collection . This is a rate that can be higher than 100%.
The CNJ, by the Justice in Numbers , calls this reference the demand fulfillment index (IAD), which "reached 108.2% in 2020, culminating in a reduction in the inventory by 2,096 thousand lawsuits. The segments of the State, Federal and Labor Courts exceeded the minimum desirable level of 100% in the IAD, with emphasis on the State Courts, which decreased 115.2% of new cases. In the Labor Court segment, only 7 TRTs recorded rates below 100%. In the Electoral Court, only two courts had a rate higher than 100% (TRE-DF and TRE-RR)".
In other words, in Brazil, the clearance rate is called the demand fulfillment index.
And, as in Brazil, congestion is a problem, the CNJ also calculates the congestion rate , using the sum of unsolved cases in the numerator, in view of everything that was processed in the year. This is a variation in perspective for calculating the accumulation, being an "indicator that measures the percentage of cases that remained pending solution at the end of the base year, in relation to what was processed (sum of pending and dismissed)". The higher, the worse the index, as it shows how much the collection has not been renewed.
In order for the index to be understood in our IAD, it is worth distinguishing the type of event that generates its calculation. In the case of the IAD, the relevant event is the distribution , which only occurs once in the life of each case. Thus, the IAD has as its object new processes. In contrast, In the case of the calculation of the congestion charge, the relevant event is the progress of the case , which occurs several times in the procedural life cycle.
Thus, the congestion rate has as its object processes that have progressed, becoming, in theory, subject to solution by the Judiciary. If judged, the cases change their status from pending to downloaded. In other words, the index measures everything that was moved, having the chance of being solved, but ended up not being solved. Or, to put it another way, The index measures the proportion of cases that remained pending judgment, despite having been moved .
The CNJ, by the Justice in Numbers , discloses that "the congestion rate of the Judiciary oscillated between 70.6% in 2009 and 73.4% in 2016. From that year on, the rate gradually drops until it reaches the lowest rate in the historical series in 2019, with a rate of 73%. In 2020, there was an increase in the congestion rate of around 4.3 percentage points, returning to the level of 2015."
One way to interpret the Brazilian data is to say that, Despite the recent effort to judge more than enough, there is still a liability that is difficult to reduce . As much as the Judiciary faces what arrives, it would still take, in many instances, around three years to placate the liabilities, even if no new case was distributed.
The other indicator used by CEPEJ (disposition time) refers to the time it takes to judge a case.
It is an indicator measured in days, computed from the comparison between pending and resolved facts.
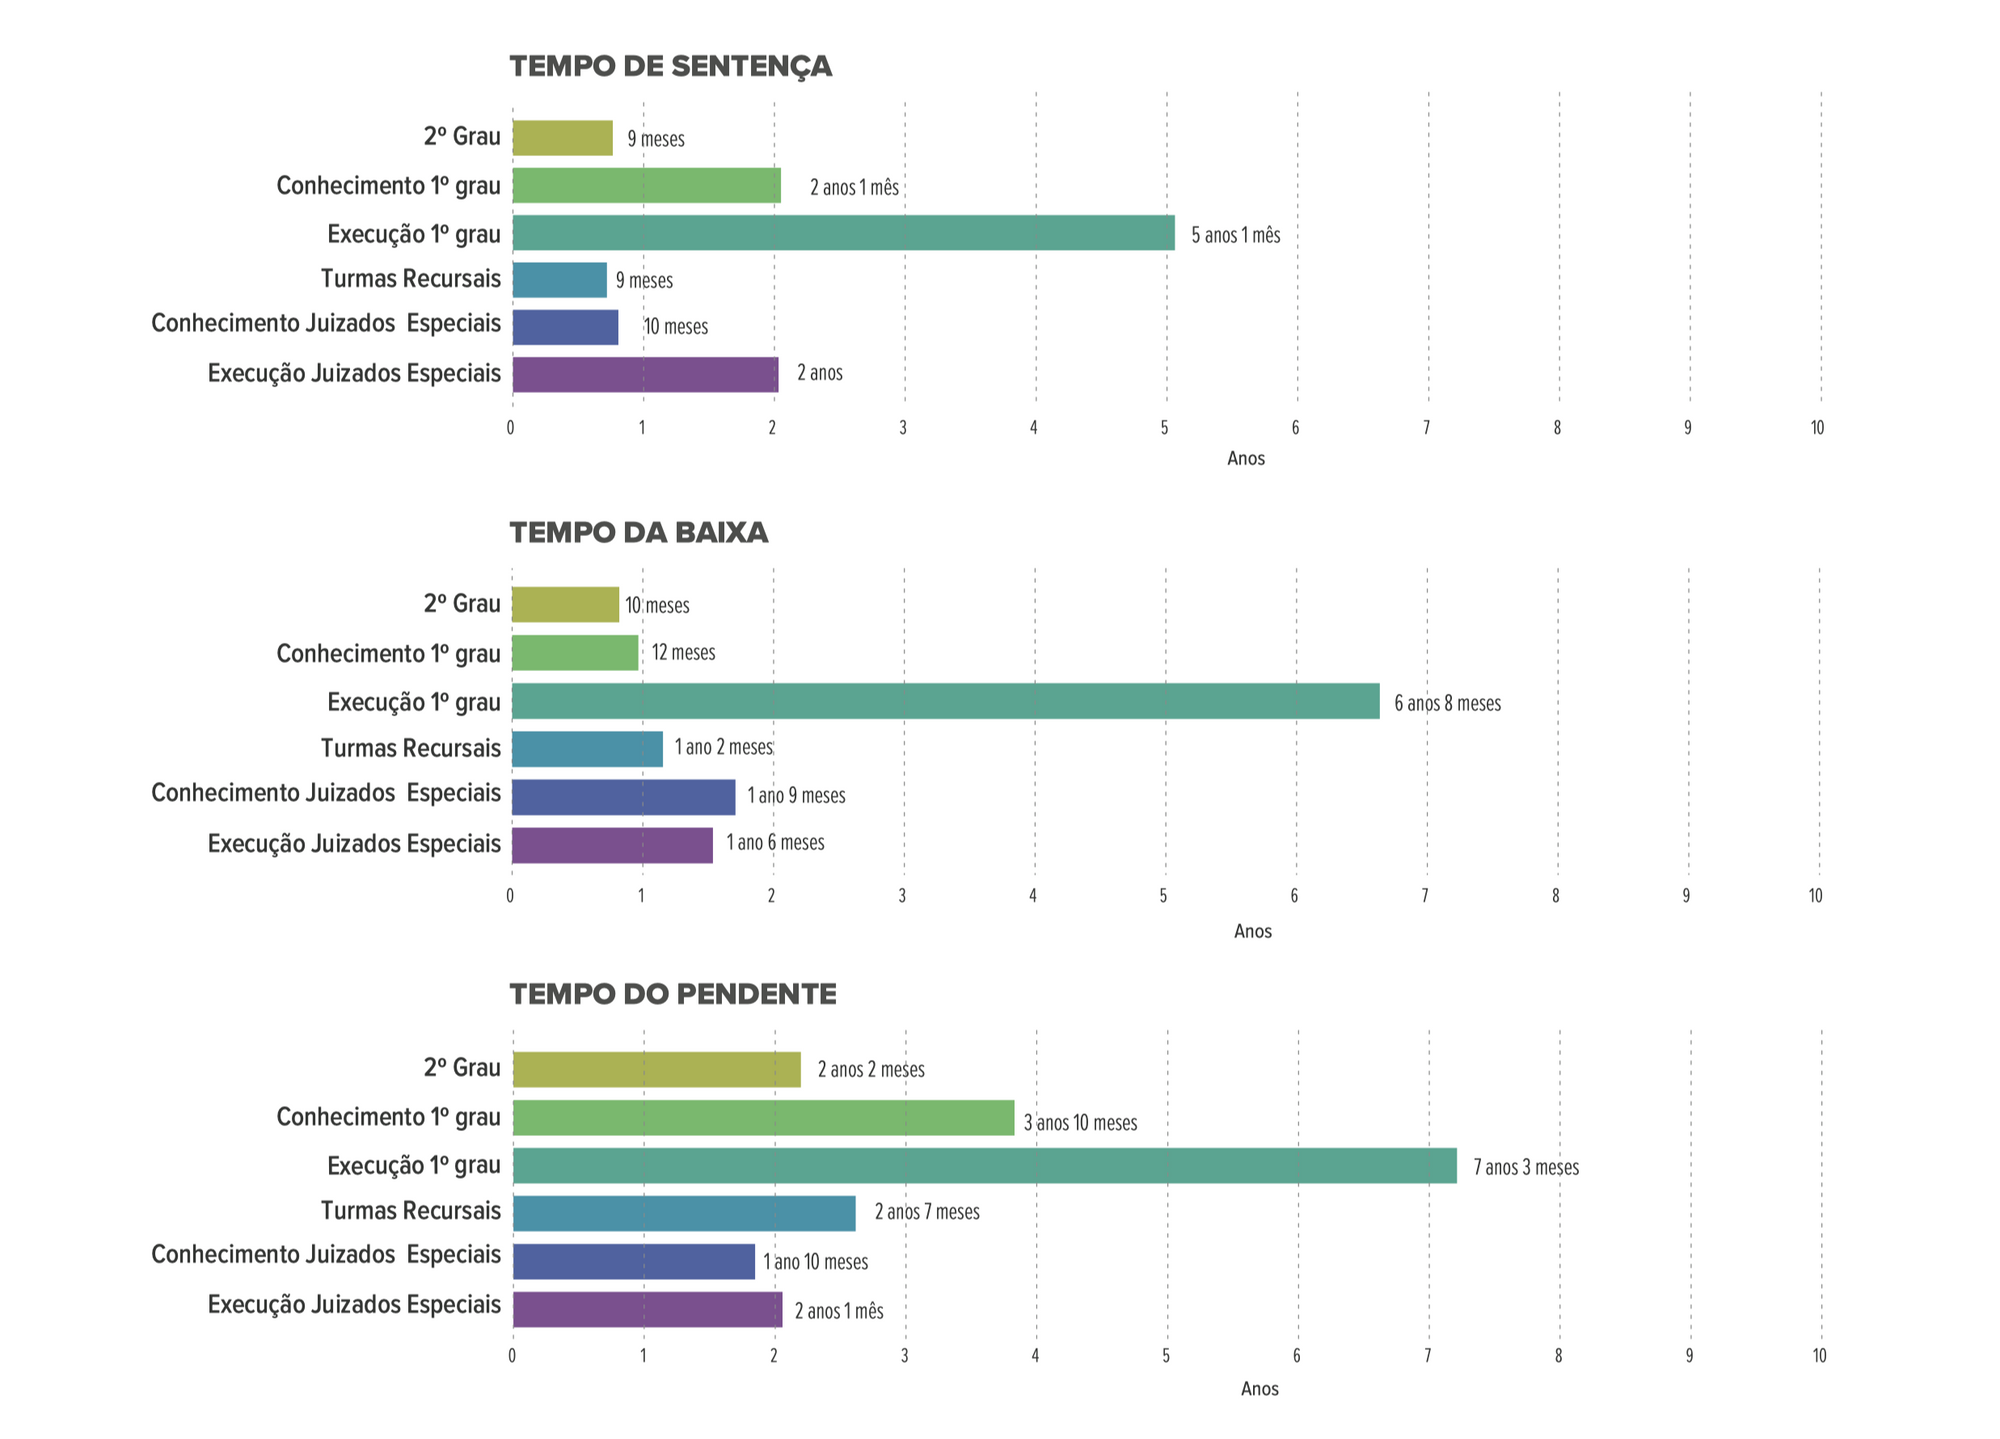
In the case of Brazilians, in terms of the average time until the dismissal of a case, Justice in Numbers informs, for example, that a case takes 3 years and 10 months in the first degree and 2 years and 2 months in the second degree. That is, the sum of the knowledge and appeal phases is 6 years . But as we have always known, The biggest bottleneck is in the execution of extrajudicial titles, as it lasts 7 years and 3 months in the first degree . And the most serious case is that of tax foreclosure, as it lasts more than 1 year than other extrajudicial foreclosures.
As can be seen, it is not exactly easy to understand judicial indicators. In addition, the lack of parallel between Brazilian and foreign indicators makes comparisons even more complex.
In any case, it is possible to say that Europe's clearance rate is around 99.7%, while Brazil's may be even higher. This does not mean that the Brazilian situation is better , because apparently what happens in Brazil is a higher yield at the moment, without prejudice to a huge and persistent accumulation. After all, it is not very intuitive that, in the Brazilian case, even with an indicator of more than 100%, the judgment of the collection requires years of work - even in a hypothetical situation of suspension of distribution.
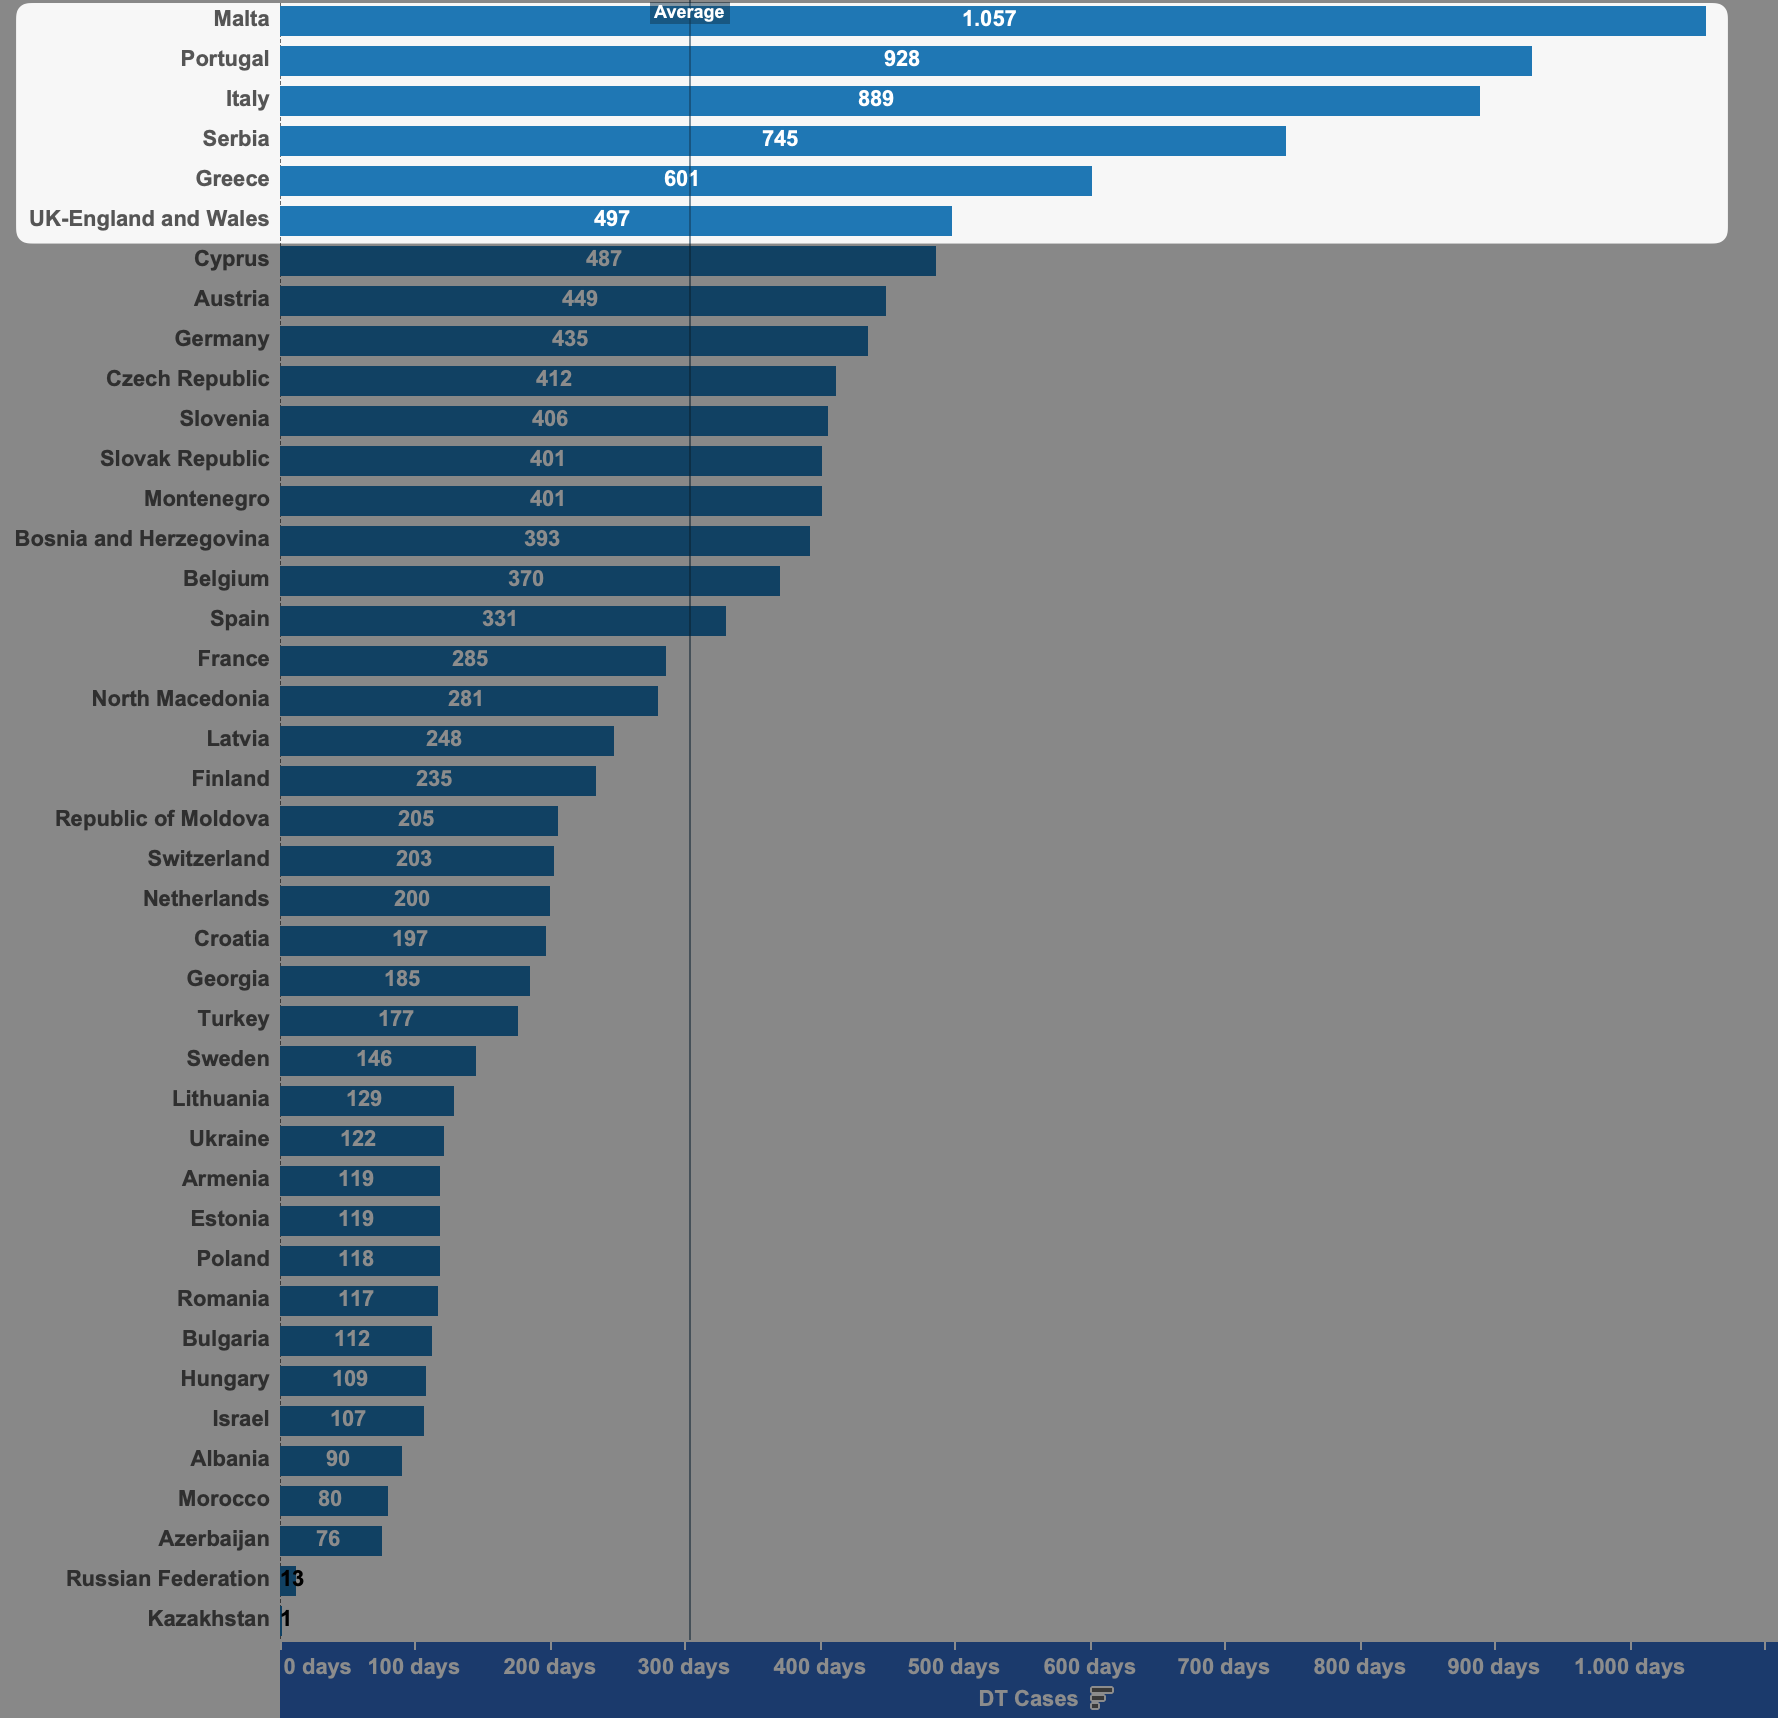
The trial time is much more relevant to understanding the health of the judicial system, because in Europe the median duration of a process is 205 days. The sentence time alone in the Brazilian case would be three times , in addition to all the appeal delay and also the satisfactory phase. This seems to be an eloquent indicator that represents the situation we are experiencing in Brazil.
Congestion and duration of proceedings in Europe and Brazil
Comparison of congestion and duration of processes based on data from the CNJ and the Council of Europe.
As previously discussed, there are two indicators widely used in comparative law when the purpose is to measure the efficiency of a judicial system: the level of response to demand and the duration of the proceedings. Recap these concepts here, if you prefer:
 Henrique Costa
Post detailing the methodology of the indicators
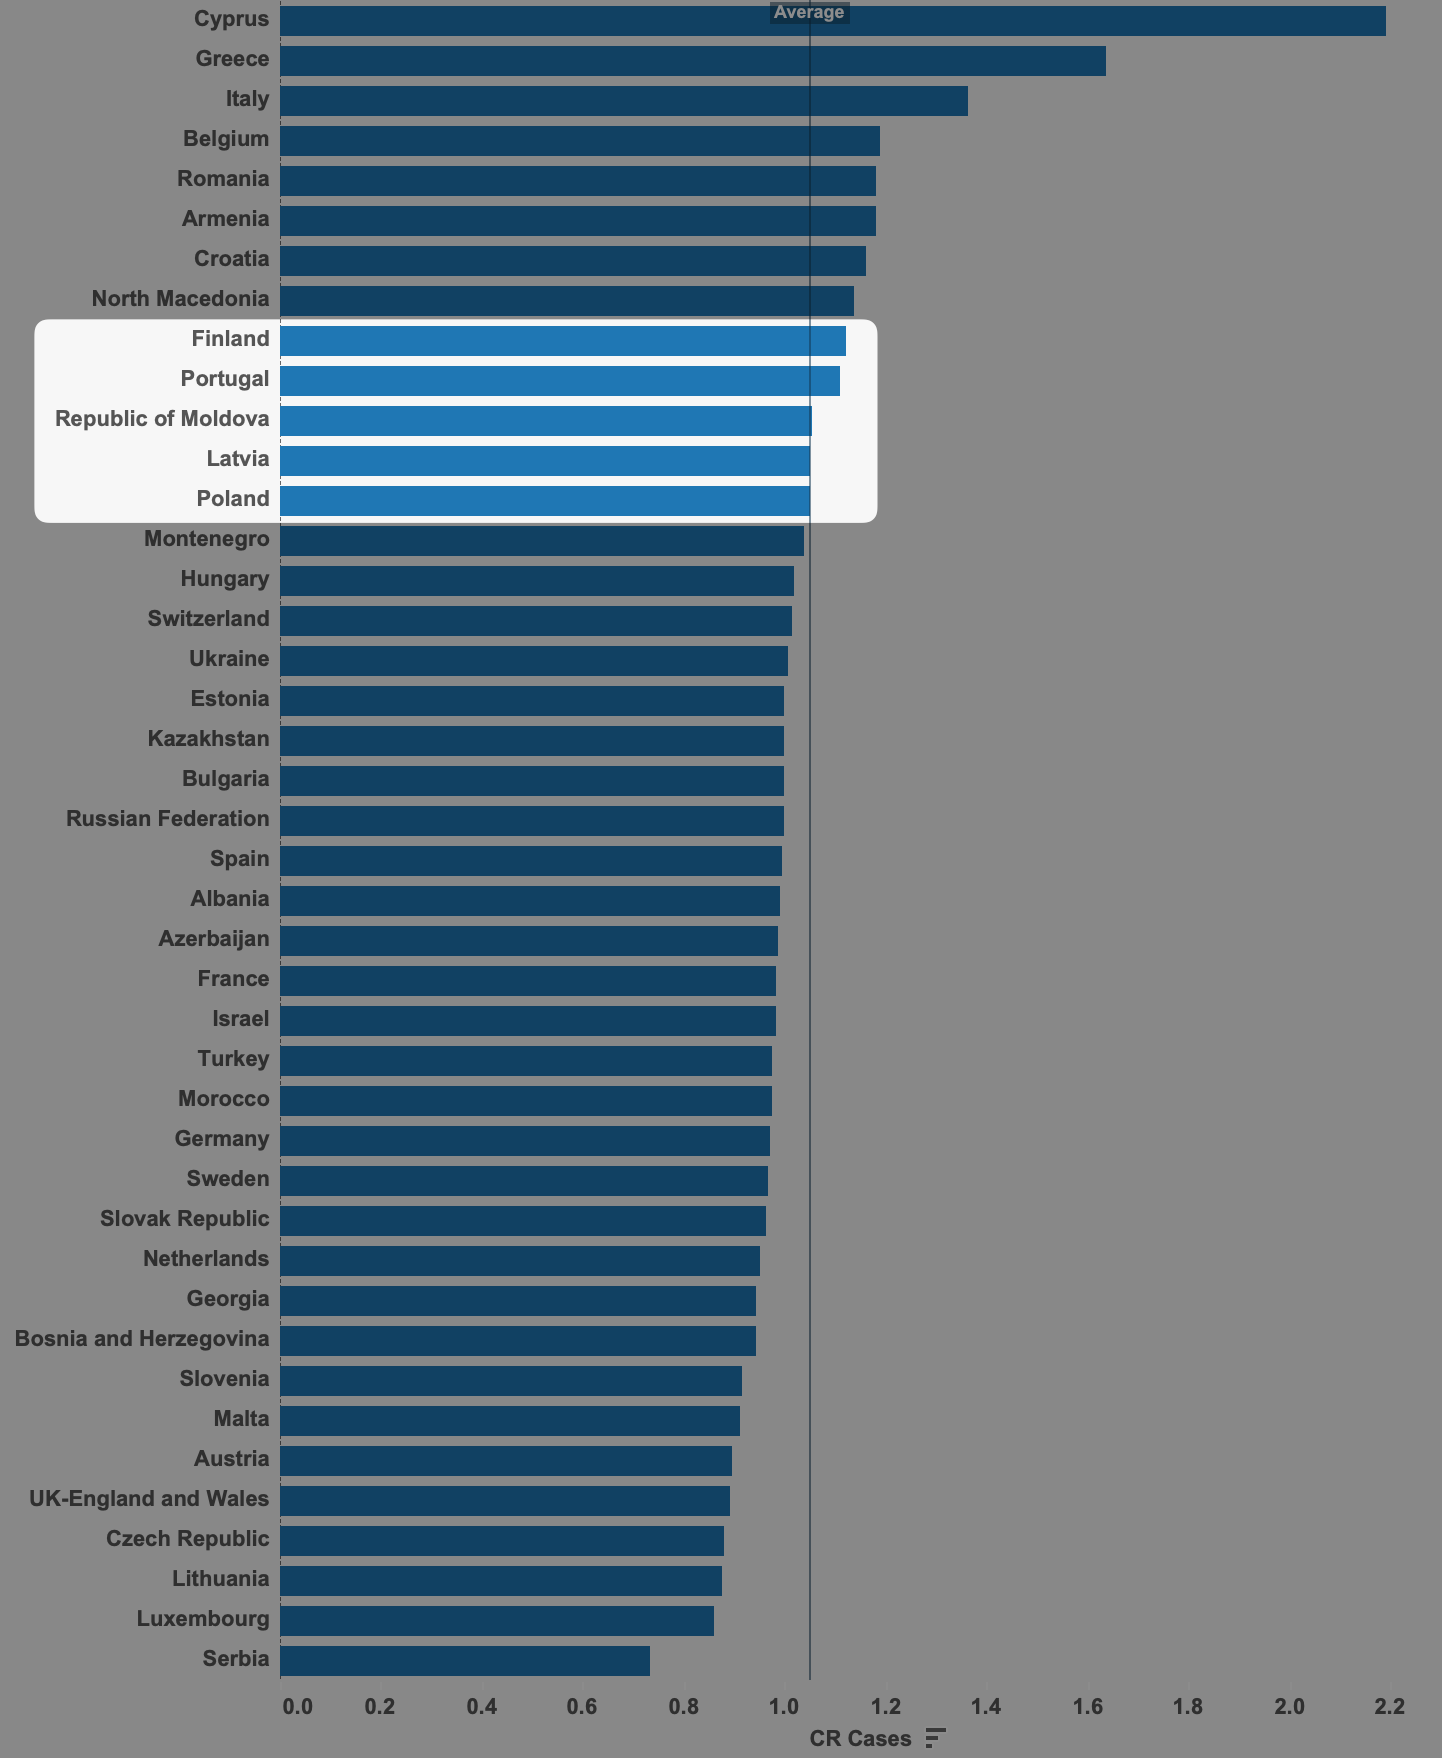
With regard to meeting demand, we have seen that Brazil has been reaching levels close to 110% of annual demand . This puts us close to the Finland and Portugal . The top of this indicator is occupied by Cyprus, Greece and Italy , which confirms that - in isolation - this is not a sufficient indicator to attest to the health and quality of the Judiciary.
It is enough to see that there are several developed countries occupying the lower average of this ranking, as is the case of the following: United Kingdom, Austria, Netherlands, Sweden and Germany :
In addition to the level of demand fulfillment (IAD), there is a more useful indicator, but also more complex to be portrayed. It is the duration of the processes. To begin with, Brazil reports the average indicator in years (6 years of pending proceedings between the first and second levels of jurisdiction). In other words, the duration of the knowledge phase of a process exceeds 2 thousand days in Brazil .
But, to be in a more comparable situation, let's assume that the duration of a process in Brazil was only that of knowledge in the first degree of jurisdiction, which is equivalent to almost 1,400 days. This duration would already be 40% longer than the slowest judiciary in Europe. So the process in Brazil is very long from any perspective.
Being incomparable with the European standard of expectation of timely solution, it is only up to us to report some curiosities. Portugal, Italy, the United Kingdom and Germany are in the group of the 10 slowest But Portugal is three times slower than average . The presence of the United Kingdom in this ranking is also noteworthy, as Brazil, Portugal and the United Kingdom have recently reformed their procedural systems.
I still don't know if the procedural reforms of these countries (which share the value of a powerful judge) were a cause or a consequence of the delay. I suppose that these reforms have increased the cost of the process, in terms of time and money, in Portugal and the United Kingdom. It would be a good subject for a future post. Studying comparative law is really an inexhaustible source of hypotheses.
The latest CEPEJ study on judicial budget in Europe It is relative to the year 2018. The darker the country, the richer it is in proportional terms (GDP per capita). The larger the circle, also proportionally, the more expensive the Judiciary is (judicial budget per capita).
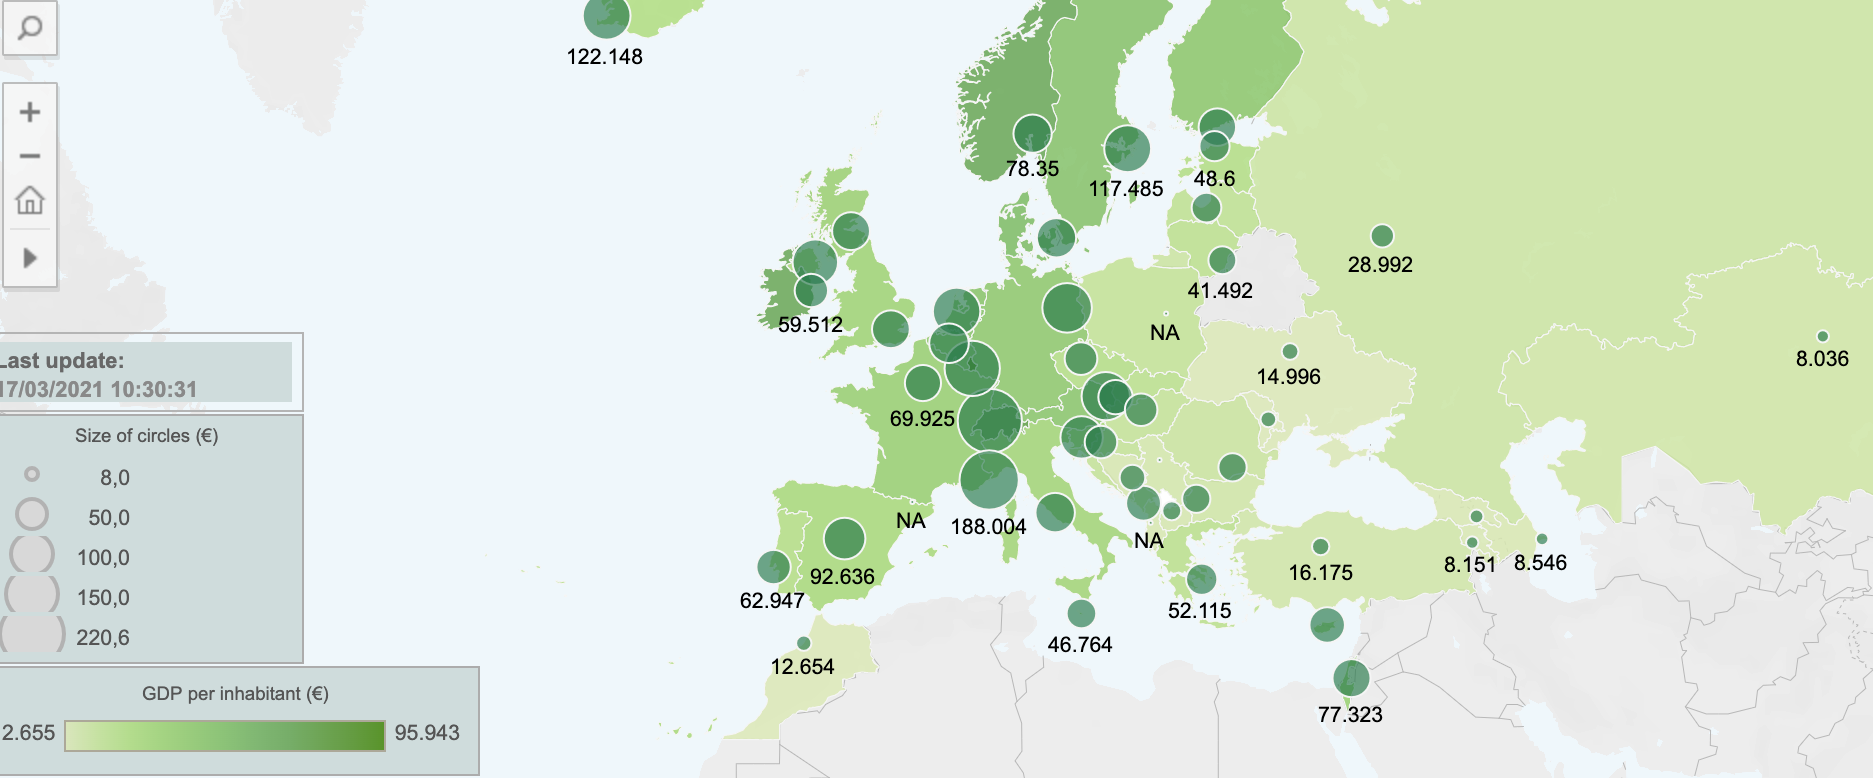
The country that spends the most annually is Switzerland (€ 220 /inhabitant/year), and it is also the country with the highest GDP per capita (€ 73,697 /inhabitant/year). Also clashing, Monaco comes next.
There is a second platoon, formed by Germany, Austria, the Netherlands and Sweden , all with intermediate income (greater than € 40 thousand/inhabitant/year). It seems that, although it is an intermediate income, it is a sufficiently high level to form the floor of a group of comparable countries. These countries spend a lot of money on the judiciary.
In contrast, even within countries with intermediate and high income (greater than € 40 thousand/inhabitant/year), there is the group of countries that invest less than the average in the Judiciary: Denmark, Norway, Finland and Ireland . These countries do not spend much money on the judiciary.
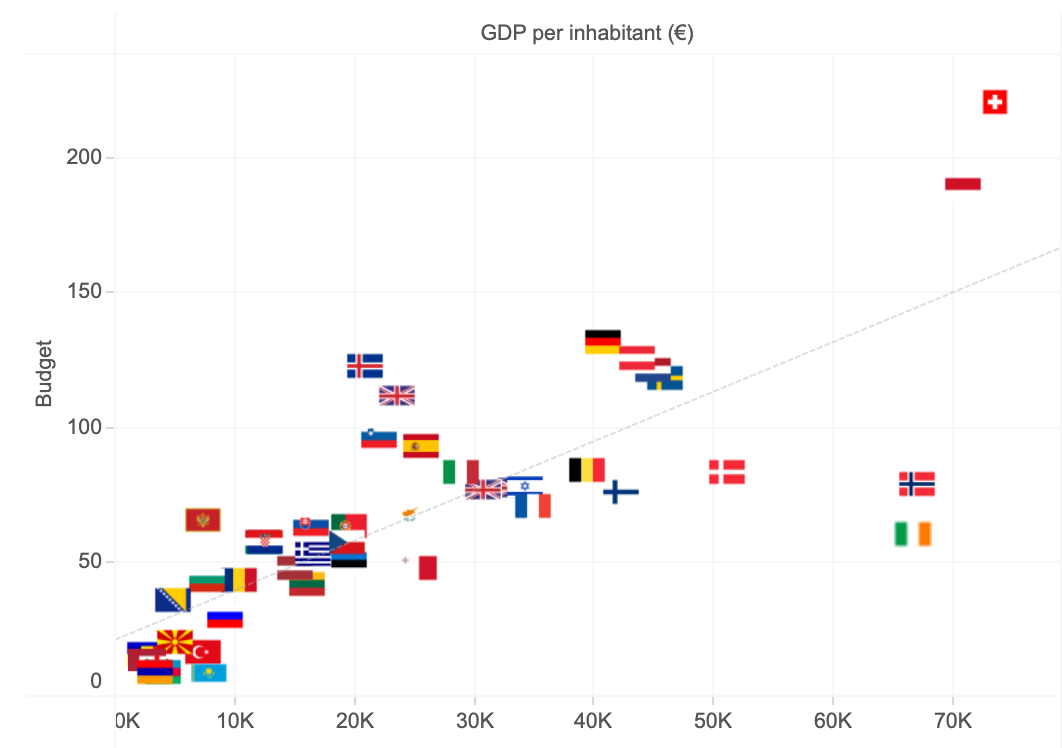
Also analyzing the countries with a slightly lower GDP (from € 26 thousand to € 40 thousand/inhabitant/year), it is possible to find a block that spends on average (from € 70 to € 80 /inhabitant/year). They are: Belgium, United Kingdom, France and Italy . They are a kind of average of the European average.
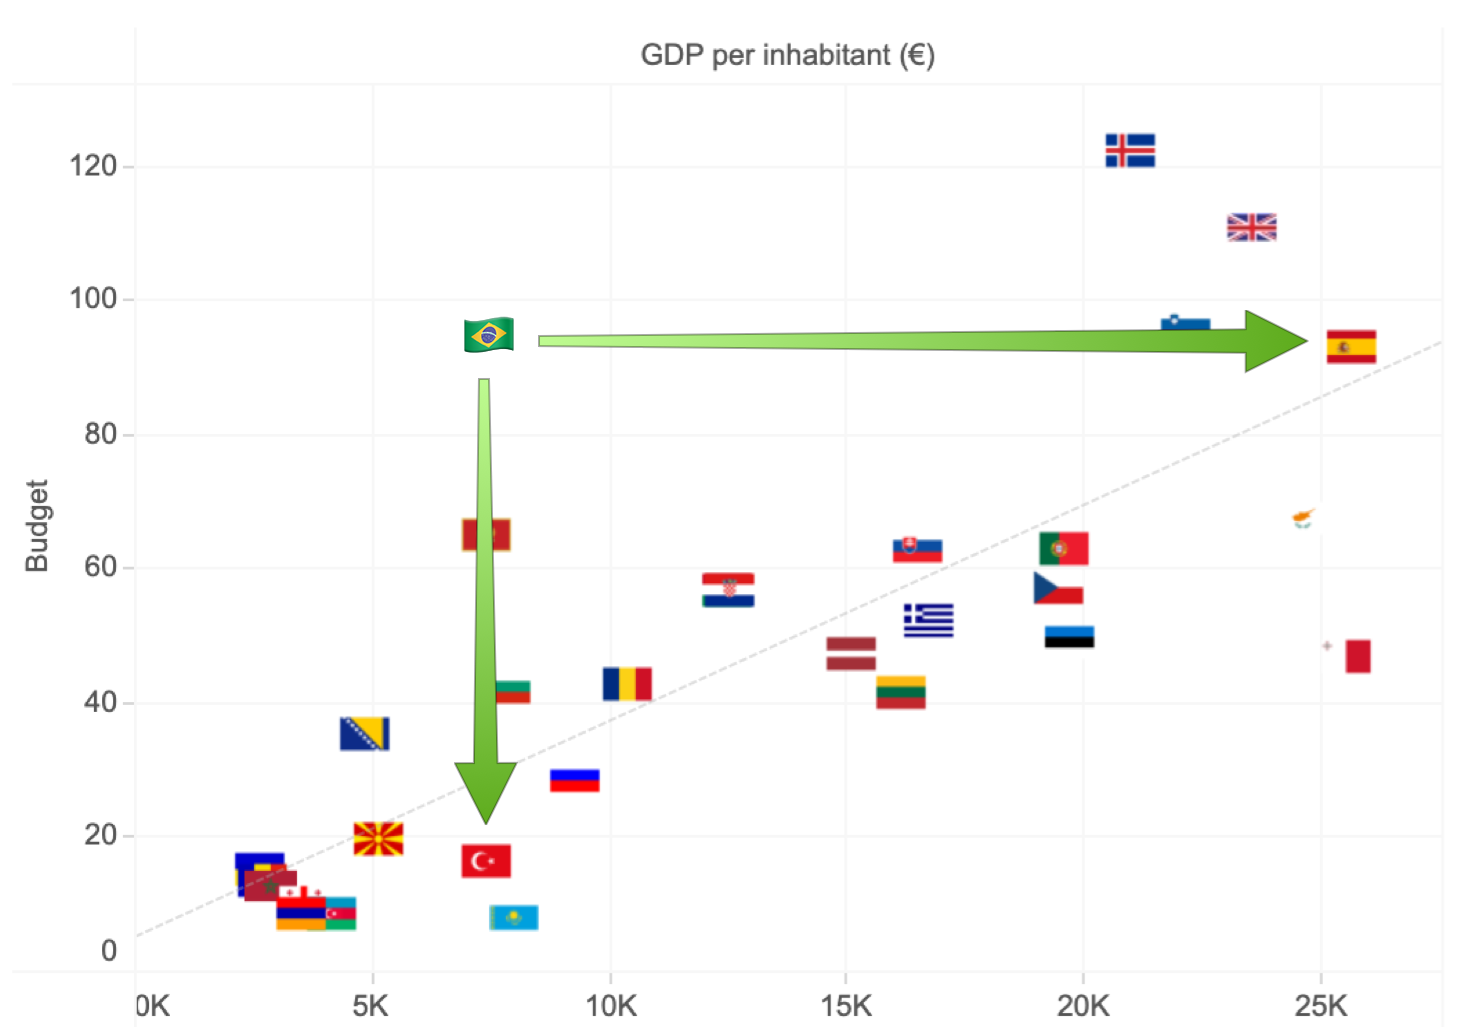
In the same period, the Brazilian GDP per capita was (€ 7,789 /inhabitant/year), considering a population of 209.5 million Brazilians (Source: World Bank ). The judicial budget, in turn, was 102.1 billion for 2018, which resulted in per capita spending of R$ 489.58 (Source: C NJ). This places Brazil with a per capita expenditure of around € 91.77.
With all the problems that this approach can have, there is something that proves its value. This is a proportional comparison, which is why we can conclude that the Brazilian Judiciary is expensive, compared to the lowest-income group in the sample .
Brazil's income level allows for a more adequate comparison with Eastern Europe. Even so, Brazil would occupy a blank place in the European diagram, since none of the lower-income countries spends around € 90 /inhabitant/year. This spending is comparable to that of Spain, whose proportional GDP is more than three times higher. Income, in turn, would put Brazil in line with Turkey, which is its approximate position in the graph:
In a future post I will compare the same data, not from the perspective of the inhabitant, but from the percentage of the judicial budget over the GDP. It is also another way of investigating whether our Judiciary is expensive or cheap.
According to the latest report by CEPEJ (European Commission for the Efficiency of Justice), the United Kingdom does not plan a comprehensive reform of its judicial system , nor change your budget. For example, structural changes, changes in the number of courts, changes in the form of management, construction of buildings, etc. are not underway.
With regard to access to justice, there is a bill to review legal aid in criminal cases. The discussion is motivated by greater control of expenses and more effective sanctions in cases of abuse in legal aid.
Since 2019, the High Judicial Council has existed , a council made up of all magistrates in the United Kingdom, whose mission is to promote excellence in the exercise of jurisdiction. The executive functions are the responsibility of a Board, as well as the Judicial Studies Committee, which operates in the same way as a school of magistracy. The Council also has a correctional function conducted by a committee that has external members in its composition.
With regard to the legal professions, a Bill to give more transparency to the process of appointing magistrates . The current rule has been in force since 1995 and organizes the Judicial Appointments Commission.
What is intended is that the new commission (which has a lay majority) selects and recommends magistrates for appointment, as well as enables wide publicity on the criteria required of candidates. One of the biggest changes in the system should be the formation of triple lists, instead of lists with seven names, as those currently drawn up.
In addition, since 2018, the Mediation Act has created a system for promoting dispute resolution through mediation. The objective is to reduce costs for the parties, making the process faster.
Finally, since 2012, the Penal Policy Review Group ( PPRG ), whose objective is to promote a broad review of penal policy. The report presented in 2014 has 43 recommendations and has been monitored by an implementation group since 2015. Among the measures discussed are the search for alternatives to custody, the improvement of accommodation standards and prison services , demand for more discipline in the use of temporary release programs.
As in the United Kingdom, Portugal has a recent Code of Civil Procedure. Therefore, the trend is that, in the coming years, the reforms to be made will concern the cost of legal aid, as well as the prison system. It is worth remembering that the CEPEJ reports do not only deal with civil procedure, but with the law as a whole.
I still intend to develop this post, but What comes to mind today is that there is a cycle in reforms . Elsa presents themselves as a thickening of aspirations. It is a movement that affects the entire community of one country and the scientific community of several. Hence the existence of concomitant reforms.
After the renovation, there is a time of leveling expectations. Working groups are created to monitor the results and address persistent problems, such as the expansion of access to justice and its cost of administration.
Meanwhile, new cycles of expectation are emerging, as is the growing expectation about the potential application of artificial intelligence in Justice. This is a cycle that is currently at its peak, which is why it is most likely that a cycle of frustration and leveling expectations will begin. And so we continue in cycles, making reforms as experiments.